
By Financial Markets Intelligence Desk
Published: September 12, 2026
Executive Summary & Key Diagnostics
-
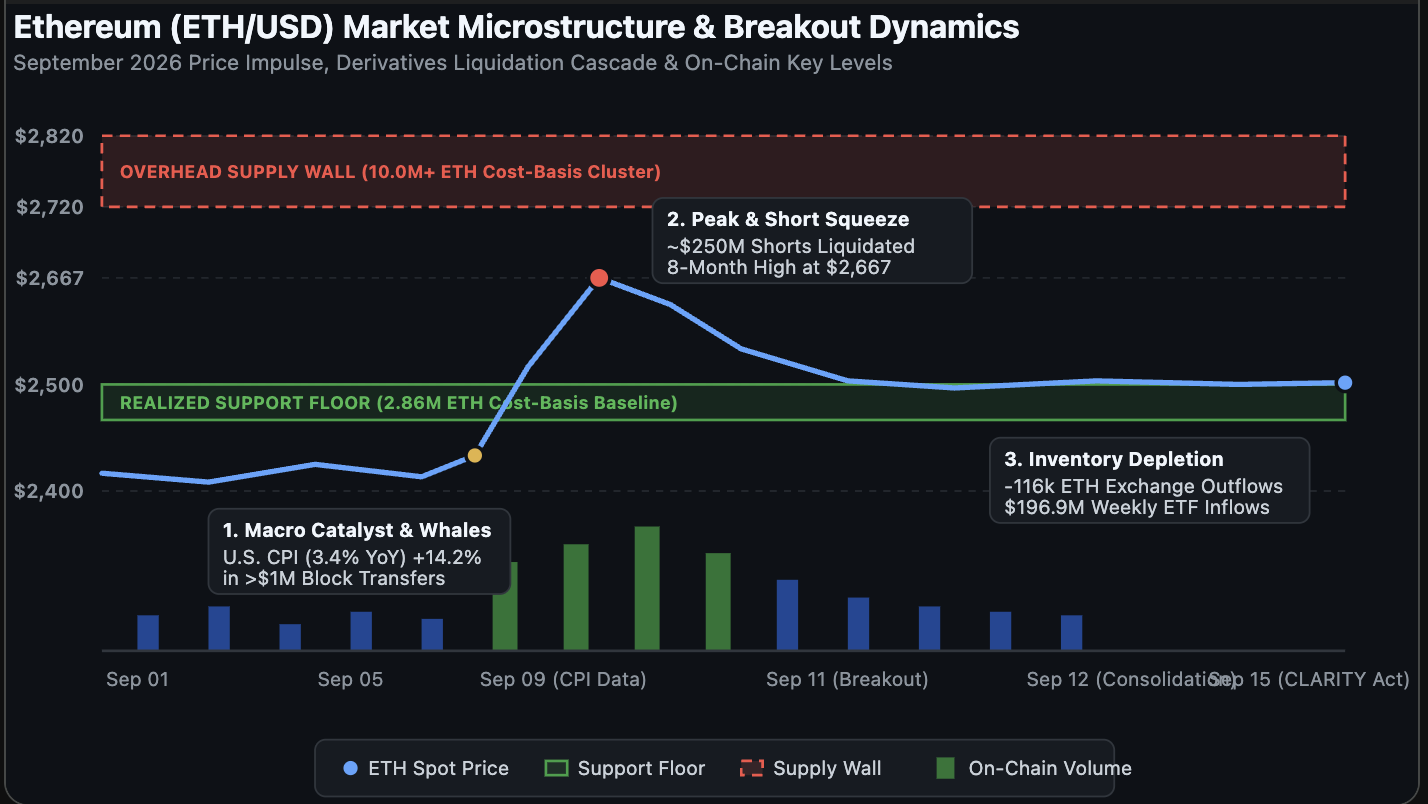
Spot Price Impulse: Ethereum (ETH) expanded 8% in a compressed volatility window, breaching $2,500 to hit an 8-month peak of $2,667 before localized profit-taking settled spot prices near $2,500.
-
Whale Accumulation Signals: Large-block on-chain transactions exceeding $1,000,000 in nominal value surged 14.2% during the upward trajectory, indicating active institutional wallet re-entry.
-
Centralized Inventory Depletion: Net exchange balances dropped by over 116,000 ETH (~$290 million) within a 48-hour window, creating a localized illiquidity vacuum across spot order books.
-
Institutional Capital Wrappers: U.S. Spot Ethereum ETFs recorded aggregate weekly net inflows of $196.9 million, providing persistent spot demand absorption.
-
Structural Market Frontiers: Immediate operational support has formed at $2,475–$2,500 (2.86M ETH cost-basis cluster), while an overhead supply wall of 10+ million ETH looms between $2,720 and $2,820.
I. Anatomy of the Breakout: Macro Triggers and Derivative Mechanics
The financial architecture behind Ethereum’s rapid climb from sub-$2,500 consolidation to an 8-month high of $2,667 was catalyzed by a confluence of macroeconomic alignment, structural order-book thinning, and a classic derivative-market clearing event. For further context on general asset class movements, see our internal Macroeconomic Volatility & Asset Rotation Guide.
The initial price impulse coincided with the release of U.S. macroeconomic data. Headline Consumer Price Index (CPI) metrics printed at 3.4% year-over-year, while Core CPI printed at 2.4% year-over-year. Matching consensus forecasts, the data alleviated short-term fears of persistent inflationary spikes. This baseline provided a favorable risk-on tailwind across financial markets, setting the stage for digital assets to absorb resting liquidity. Check the official U.S. Bureau of Labor Statistics CPI Releases for primary economic data.
+-----------------------------------------------------------------------+
|                       BREAKOUT MECHANICS FLOW                         |
+-----------------------------------------------------------------------+
|  U.S. CPI Macro Baseline (Headline 3.4% YoY / Core 2.4% YoY)          |
|                                  │                                    |
|                                  ▼                                    |
|  Whale Block Buying (+14.2% in >$1M On-Chain Transfers)                |
|                                  │                                    |
|                                  ▼                                    |
|  Exchange Supply Squeeze (116k ETH Removed to Cold Storage / Staking) |
|                                  │                                    |
|                                  ▼                                    |
|  Derivative Cascade (~$250M Leveraged Shorts Force-Closed)             |
|                                  │                                    |
|                                  ▼                                    |
|  Vertical Spot Impulse Peak ($2,667) ──> Consolidation ($2,500)        |
+-----------------------------------------------------------------------+
As spot buying initiated, the derivative market’s structural asymmetry amplified the upward velocity. In the weeks leading up to the breakout, funding rates across major perpetual swap venues had drifted near zero or into negative territory, signaling a heavy tilt toward defensive short hedging. When spot buying cleared thin ask orders on centralized order books, these leveraged short positions were placed under immediate margin pressure.
As spot prices crossed the $2,500 psychological barrier, automated risk-engine liquidations were triggered. In total, approximately $250 million in leveraged short positions were forcefully closed within a two-hour execution window. Detailed order book analytics are documented in our Derivatives Liquidation Engine Taxonomy. Because market-order liquidations execute as non-discretionary buy orders, they created a self-reinforcing buying loop a short squeeze that propelled ETH vertically to its peak of $2,667 before organic sell-side liquidity halted the expansion.
II. On-Chain Forensics: Whale Accumulation vs. Retail Distribution
While price action on centralized exchanges reflects the immediate matching of buy and sell orders, on-chain telemetry provides a transparent view of underlying ledger movements. Analyzing transaction sizes, wallet age, and entity-level holdings reveals distinct behavioral divergence between retail traders and institutional-grade entities. Track live transaction feeds via Etherscan On-Chain Intelligence.
1. Large-Block Transaction Velocity
On-chain diagnostic tools tracking transaction clusters above $1,000,000 equivalent registered a sharp 14.2% increase in execution frequency during the run-up. Multi-sig wallet addresses associated with institutional desks and OTC trading venues were net receivers during the spike, indicating major entities were actively sweeping offer liquidity rather than distributing assets.
2. Exchange Inventory Drains and Staking Allocations
One of the key structural signals during this rally was the sharp reduction in exchange-held supply. Over a 48-hour period, centralized exchanges experienced net outflows totaling 116,000 ETH (~$290 million). A substantial portion originated from institutional custodial vaults moving directly into cold storage or being locked into native Ethereum staking protocols, compounding spot illiquidity dynamics. Explore our internal Institutional Cold Storage & Staking Framework for structural models.
3. ETF Inflow Dynamics
Adding an institutional layer to spot demand, U.S. Spot Ethereum ETFs generated $196.9 million in net weekly inflows. This persistent institutional bid via traditional brokerage rails acts as a baseline demand sponge, steadily absorbing daily unlocked supply independent of speculative derivatives trading. View fund metrics on SoSoValue ETF Tracker.
III. Microstructure & Order-Book Mechanics: Support & Supply Walls
To evaluate where Ethereum’s market structure settles following this volatility surge, analysts must map the underlying position cost-basis distribution. On-chain volume-by-price data maps where market participants acquired their tokens, identifying precise price bands where profit-taking, break-even selling, or re-accumulation are statistically most likely to occur.
| Price Band | Estimated On-Chain Volume | Structural Market Classification | Primary Trader Behavior |
| $2,475 – $2,500 | ~2.86 Million ETH | Primary Realized Support Floor | Breakout consolidation baseline; short-term re-accumulation floor. |
| $2,660 – $2,667 | ~850,000 ETH | Immediate Local Pivot High | Liquidation peak; algorithmic profit-taking and local rejection point. |
| $2,720 – $2,820 | >10.00 Million ETH | Overhead Supply Wall | Heavy break-even selling from trapped buyers; major macro resistance. |
+-----------------------------------------------------------------------+
|                     PRICE DENSITY & SUPPLY PROFILE                    |
+-----------------------------------------------------------------------+
|  $2,820 ──┐                                                           |
|           ├─► OVERHEAD SUPPLY WALL (10.0M+ ETH Cost-Basis Cluster)     |
|  $2,720 ──┘   [Heavy Break-Even Selling Pressure Expected]            |
|                                                                       |
|  $2,667 ───► RECENT 8-MONTH PEAK (Local Rejection / Squeeze Peak)      |
|                                                                       |
|  $2,500 ──┐                                                           |
|           ├─► REALIZED SUPPORT FLOOR (2.86M ETH Cost-Basis Cluster)   |
|  $2,475 ──┘   [Structural Re-test Floor / New Support Baseline]       |
+-----------------------------------------------------------------------+
The Overhead Supply Wall ($2,720 – $2,820)
The primary obstacle preventing an uninhibited run toward higher levels is the dense concentration of positions held between $2,720 and $2,820. On-chain distribution charts indicate that over 10 million ETH were acquired within this narrow band during previous consolidation periods before subsequent market downturns. See our detailed On-Chain Cost-Basis Mapping Report for address-level breakdowns.
Market participants who bought inside this corridor have carried unrealized losses for months. In behavioral finance, such zones represent “overhead supply walls.” As spot price approaches these entry points, trapped market participants frequently place sell orders to exit at break-even ($0 net profit/loss). For Ethereum to breach $2,820 and sustain a long-term bullish trend, spot market buyers must demonstrate sufficient capital depth to absorb this 10-million-ETH selling overhang.
Realized Support Conversion ($2,475 – $2,500)
Conversely, the downside risk profile is anchored by a newly established realized support floor at $2,475–$2,500. On-chain transaction records confirm that approximately 2.86 million ETH changed hands within this range prior to Friday’s breakout. In classical technical analysis, when a major resistance zone is broken with high volume, it flips to become structural support. If pullbacks occur, this $2,475–$2,500 cluster provides the operational demand baseline necessary to absorb selling pressure and prevent a deeper collapse back toward lower liquidity pockets.
IV. Emerging Macroeconomic & Regulatory Catalysts
As the market digests the recent price movement, traders and institutional risk managers are positioning ahead of two upcoming catalysts scheduled for mid-September 2026. These events possess the potential to alter market liquidity, volatility expectations, and asset valuations across the digital asset sector.
1. U.S. Senate CLARITY Act Vote (September 15, 2026)
Legislation surrounding the regulation of digital assets faces a vote in the U.S. Senate on September 15. The CLARITY Act aims to formalize statutory boundaries between the Commodity Futures Trading Commission (CFTC) and the Securities and Exchange Commission (SEC). Review legislative updates via the official U.S. Senate Committee Directory. Clear classification of Ethereum as a digital commodity under CFTC oversight would eliminate regulatory ambiguity, allowing sidelined institutional capital pools to deploy directly into Ethereum infrastructure and spot products without compliance friction.
2. Federal Open Market Committee (FOMC) Rate Decision (September 16, 2026)
Following the Senate vote, the Federal Reserve will announce its interest rate decision on September 16. Macro money markets are closely evaluating potential shifts in benchmark interest rates. Track rate expectations via the Federal Reserve FOMC Calendar. A rate cut or dovish policy stance would compress real yields on risk-free cash instruments, incentivizing investors to seek higher yields in risk-on assets and enhancing liquidity across decentralized finance ecosystems. For broader asset implications, see our internal Federal Reserve Rate Cycle Playbook.
Leave a Reply